

Families across the nation are doing better, and public programs like SNAP and refundable tax credits continue to play a critical role in those improvements. This morning, data from the 2016 Current Population Survey was released, giving us insight into the importance of federal programs that continue to drive down poverty and improve the economic future that all of us share.
Federal programs lift our economy:
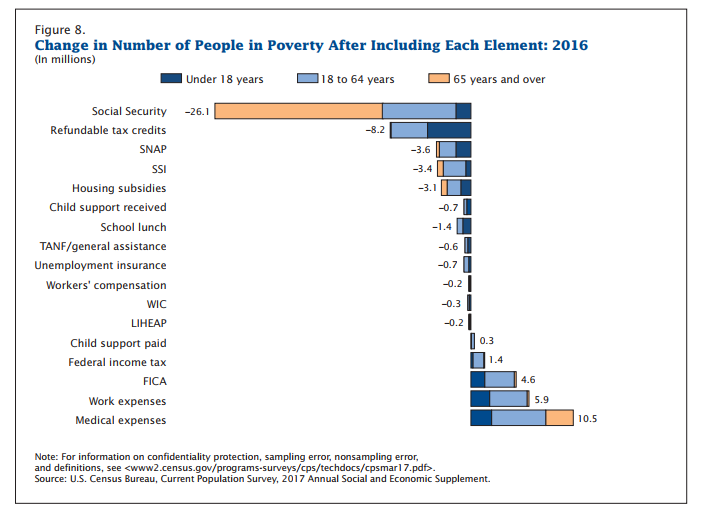
Social Security is still the biggest anti-poverty program, responsible for lifting 26.1 million people above the poverty line in 2016. Other programs like refundable tax credits (8.2 million people lifted out of poverty) and SNAP (3.6 million) also help our communities grow and thrive. [1] Recent federal budget recommendations threaten to cut or end many of these programs. Without them, we would not have the supports needed to keep national and state economies strong.
Although economic opportunity is still out of reach for too many families, household income did go up overall from 2015 to 2016. That means that a typical middle-income family is making about $1,800 more a year. Another good sign is a decrease in national poverty rates. Policy changes that help to remove obstacles for families who are struggling to make ends meet are critical for keeping these poverty levels low, and ensuring that all of us have a bright economic future.
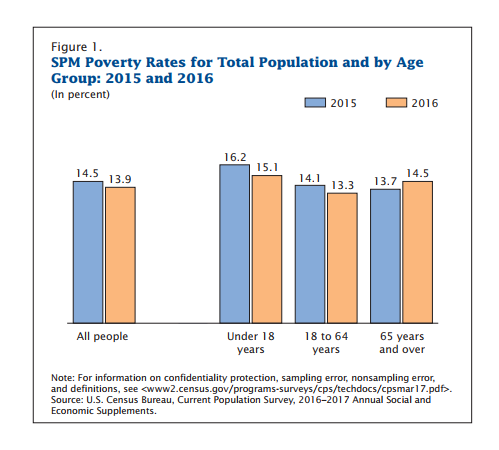
The Official Poverty Rate decreased by about .8 percentage points (to 12.7 percent), or 2.5 million people. Another measure of poverty, the Supplemental Poverty Measure, also went down but by only .6 percentage points. According to that measure, the only major group whose poverty levels increased was seniors, going up from 13.7 percent poverty in 2015 to 14.5 percent in 2016. [2] The following chart shows the change in the Supplemental Poverty Measure.
A tale of two measurements:
There are two standard ways to measure poverty, the traditional “Official Poverty Measure” and the newer Supplemental Poverty Measure. Why measure poverty in more than one way, and what do those measurements tell us? The supplemental measure is a better, more modern measure of poverty. It accounts for many of the programs that have been put in place to help bring families out of poverty, and has more accurate and updated measures of how much it costs for families to get by.
While the traditional metric just looks at before-tax income, the Supplemental Poverty Measure gives us a clearer picture of family finances. That’s because it also includes important benefits such as SNAP or the Earned Income Tax Credit. It also accounts for taxes and other expenses like out-of-pocket medical costs that the traditional measure does not.
It’s also better at drawing the line of where poverty should be for different family sizes. According to the traditional measure, poverty thresholds are based on the adjusted minimum cost of food from 1963. The relatively newer Supplemental Poverty Measure considers food costs but also the cost of clothing, shelter and utilities. The traditional measure is still useful because it is a consistent, longstanding metric (we can compare poverty over many decades). However, it has limitations, and it is important to consider the supplemental measure as well because it reflects important policy improvements over time.
If you look just at the traditional poverty measure, you might conclude that families are not much better off now than they were in the 1960s. The Supplemental Poverty Measure tells the real story. The financial well-being of families has been greatly improved since then when you include important noncash benefits, like SNAP and rental assistance, that were essentially nonexistent decades ago. Perhaps more importantly, it shows how good these programs are at protecting families and economies during financial downturns. The traditional measure of poverty grew twice as much as the supplemental measure during the great recession, meaning these critical programs kept many families afloat as the economy declined.
Check out today’s new Census data on health, and stay tuned for Arkansas-specific data that will be released this Thursday, September 14th.
[1] https://www.census.gov/content/dam/Census/library/visualizations/2017/demo/p60-261/figure8.pdf
[2] https://www.census.gov/content/dam/Census/library/visualizations/2017/demo/p60-261/figure1.pdf