

Today the U.S. Census Bureau published its annual release of national-level statistics on income, poverty and health insurance coverage. As we wrote in our previous blog post, these statistics are based on the Current Population Survey, which is useful for looking at changes in poverty rates at the national level, but less so when comparing Arkansas data over time or when making comparisons between states.
While our policy staff primarily relies on American Community Survey (ACS) data, which will be released on September 26 this year, we have provided a brief analysis below of today’s release.
Health Insurance Coverage, by Loretta Alexander, health policy director
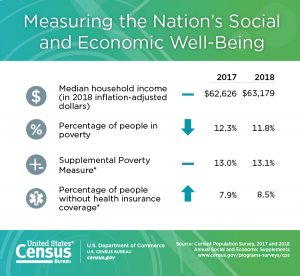
We have seen the number of uninsured people, including children, increase over the last two years in Arkansas. The report released today by the U.S. Census Bureau shows the rate and number of people without health insurance across the United States also increased, from 25.6 million (7.9 percent) in 2017, to 27.5 million (8.5 percent). The rate of children in the United States going without health insurance increased by 425,000, or 0.6 percent, between 2017 and 2018.
In a statement responding to today’s data release, Joan Alker, Executive Director of the Center for Children and Families at the Georgetown University Health Policy Institute, said, “This serious erosion of child health coverage is due in large part to the Trump Administration’s actions that have made health coverage harder to access and have deterred families from enrolling their eligible children in Medicaid and CHIP. The share of children in employer-sponsored insurance remained the same indicating that the strong economy isn’t compensating for children losing Medicaid/CHIP coverage.”
At Arkansas Advocates, we’ve seen the effects of those actions over the last two years. For Arkansas, today’s report showed an increase in people without health insurance coverage from 7.9 percent or 232,000 to 8.5 percent or 244,000, in 2018 for all ages. Detailed state-level data will be released by the Census Bureau on September 26.
On the national level, it’s important to note the highest increase of uninsured children occurred in families with incomes at or above 400 percent of the poverty level. There was little change in families with incomes less than 400 percent of the federal poverty level. Geographically, more children living in the South were uninsured than other regions.
We predict the ongoing Trump Administration changes to the Affordable Care Act will lead to more uninsured in the future. Another threat to insurance coverage is the reluctance of immigrants to seek services in the wake of federal changes to the public charge rule.
At the state level, AACF will continue working to help reverse the trend of health insurance coverage losses. Children, especially, need insurance to lead healthy lives and achieve their full potential. Arkansas has previously been a leader in increasing coverage, and we hope to regain the previous momentum.
Income and Poverty, by Bruno Showers, senior policy analyst
Census data released today show that median household income in the United States continues to rise, reflecting the cumulative effect of a record-long economic recovery that began in 2009. However, as we noted on Labor Day, these gains are not being shared equally.
Today’s annual CPS release showed that rising employment and wages continued in 2018 with median household income reaching a record high of $63,179 nationally. The official poverty rate, 11.8, is below pre-recession levels for the first time.
But a better measure of household economic security is the Supplemental Poverty Measure (SPM). It counts income from tax credits and public assistance programs and arguably gives a more accurate view of poverty (see our discussion on this topic here). Nationally, the SPM rate was not statistically different from last year, at 13.1 up from 13.0 in 2017.
Changes in how the Census Bureau processes data make year-over-year comparisons of different population groups difficult. But large disparities between different groups remain durable: nationally, the Black poverty rate was 21.0 percent and the Hispanic poverty rate was 21.2 percent, according to the SPM. Meanwhile the White, non-Hispanic poverty rate is only 8.8 percent.
Our nation’s long-term success relies on ensuring that everyone has the opportunity to thrive, but too many Black and Brown communities continue to struggle economically due to factors like a lack of access to good paying jobs, underfunded school systems, and inadequate investments in public transit and childcare.
Fortunately, the SPM also shows us how vital anti-poverty programs are in creating this shared prosperity. Refundable tax credits like the Earned Income Tax Credit and the Child Tax Credit helped move about 8 million people out of poverty in 2018. We can build on this success. The Working Families Tax Credit, for instance, would raise the incomes of 46 million households and pull more than 10 million people out of poverty.