
The federal budget reconciliation bill, signed by President Donald Trump on July 4, 2025, includes the largest cuts to Medicaid and the Supplemental Nutrition Assistance Program in history. For more information about the impact of these cuts, click here. The maps below show the projected harms to Arkansans, by county, based on estimates from the Congressional Budget Office. Because this analysis is based on estimates, the data presented in the maps are designed to communicate the magnitude of the effects of the One Big Beautiful Bill Act, and not necessarily precise values.
Watch: How to Use These Maps
Note: the following maps will be refreshed as we receive updated estimates from the Congressional Budget Office. Roll your mouse (or pointer) over districts to reveal additional information.
Medicaid Dollars Lost and Newly Uninsured by County
Source: AACF analysis assuming nearly $1 trillion in Medicaid cuts over 10 years and utilizing U.S. Census Bureau, 2019-2023 American Community Survey 5-Year Estimates. Newly uninsured calculations based on Center for Budget and Policy Priorities estimates.
SNAP Benefit Dollars and Economic Development Lost by County
Source: AACF analysis assuming $186 billion in SNAP cuts over 10 years and utilizing U.S. Census Bureau, 2019-2023 American Community Survey 5-Year Estimates. Every SNAP dollar equals $1.54 to $1.79 in economic development. Individuals at risk of losing some or all SNAP benefits based on Arkansas analysis by the Center for Budget and Policy Priorities.
Total Dollars Lost by County
Source: AACF analysis assuming nearly $1 trillion in Medicaid cuts and $186 billion in SNAP cuts over 10 years and utilizing U.S. Census Bureau, 2019-2023 American Community Survey 5-Year Estimates.
Medicaid Coverage and Hospitals by County
Source: U.S. Census Bureau, 2019-2023 American Community Survey 5-Year Estimates. Hospital data provided by the Center for Healthcare Quality and Payment Reform (financial data for rural and critical access hospitals only). The Patient Services Margin represents the profit or loss on health care services delivered to patients; the Total Margin includes all revenues and costs.
Medicaid Coverage And Tax Savings By County
Source: ACCF analysis using U.S. Census Bureau data and a report from the Institute on Taxation and Economic Policy.
Impacts of Tax Provisions in the “One Big Beautiful Bill” Act in 2026 in Arkansas
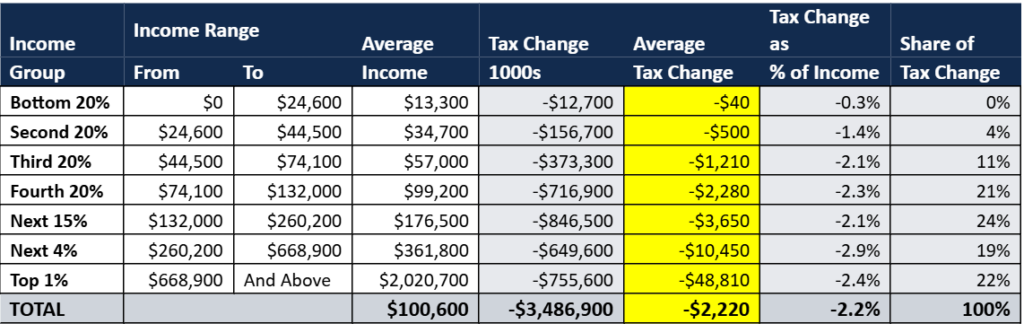
Source: Institute on Taxation and Economic Policy.
For more information about the impact of these cuts, click here.